Your dashboards are green. Your alerts are silent. And somewhere in your microservices architecture, a cascade failure is building that will take down production at 3 AM. Traditional monitoring cannot prevent this scenario because it only tells you what you already knew to ask about. Observability is different—it lets you explore the unknown unknowns.
Monitoring vs. Observability: The Critical Difference
Monitoring is about collecting predefined metrics and alerting on known failure modes. You decide in advance what to measure: CPU usage, memory consumption, request latency, error rates. When something outside your predefined measurements fails, monitoring is blind.
Observability, by contrast, is about understanding system behavior through its external outputs. An observable system lets you ask arbitrary questions without deploying new instrumentation. The difference matters most when debugging novel problems—the ones that were not in your runbook.
The test of observability: Can you understand why a system is misbehaving from outside, without adding new instrumentation?
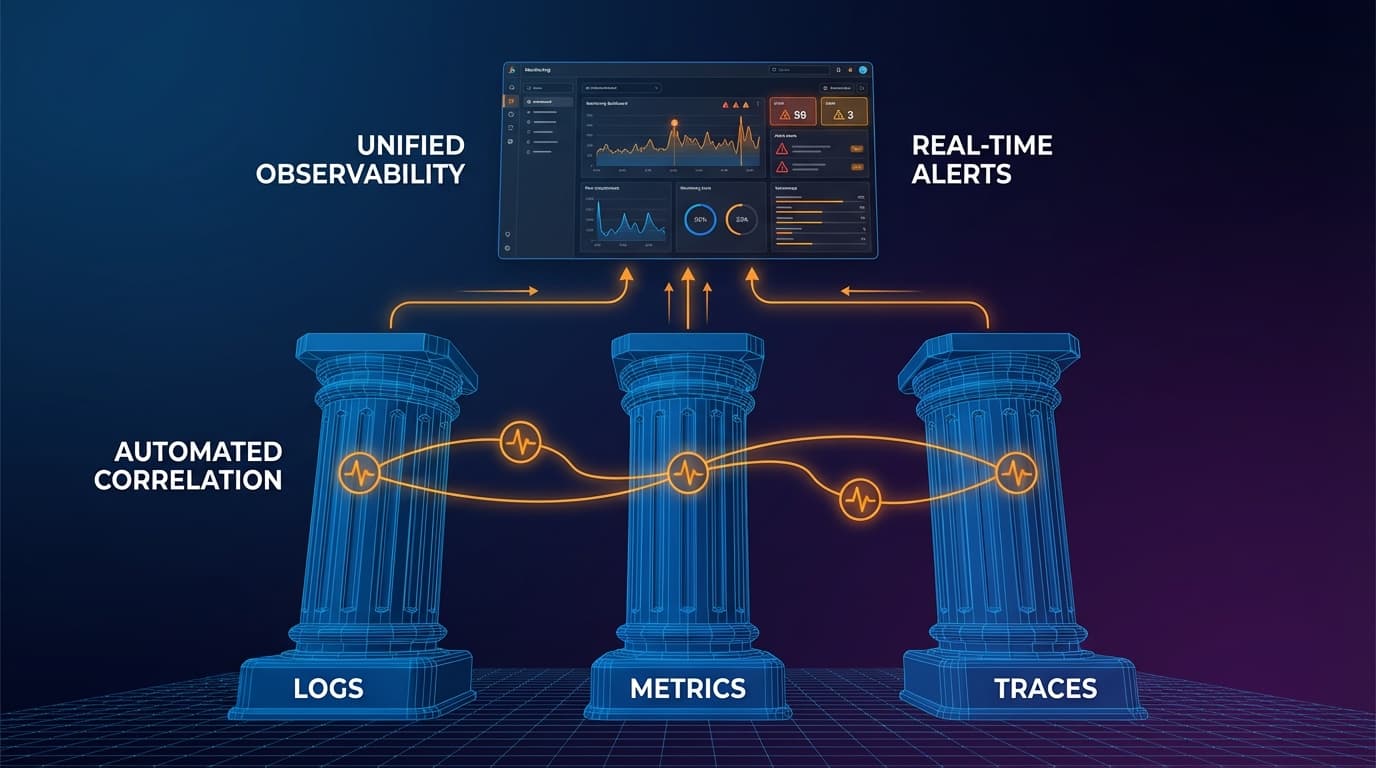
The Three Pillars Explained
Modern observability rests on three complementary data types: logs, metrics, and traces. Each serves a different purpose, and together they provide comprehensive visibility.
Pillar 1: Logs
Logs are timestamped records of discrete events. A user logged in. A database query executed. An error occurred. Logs provide the richest context but are the most expensive to store and query at scale.
Log best practices:
- Structured logging: Use JSON format, not plain text. Structured logs are searchable and parseable
- Consistent schema: Standardize field names across services (timestamp, service_name, trace_id, user_id)
- Appropriate verbosity: Debug logs in development, info/warn/error in production
- Correlation IDs: Every log should include a trace ID that connects it to related events
Pillar 2: Metrics
Metrics are numeric measurements aggregated over time. Request rate, error rate, latency percentiles, resource utilization. Metrics are cheap to store long-term and excellent for dashboards, alerting, and trend analysis.
The four golden signals:
- Latency: How long requests take (p50, p95, p99 matter more than average)
- Traffic: How much demand hits your system
- Errors: The rate of failed requests
- Saturation: How full your system is (memory, CPU, disk, connections)
If you monitor nothing else, monitor these four signals for every service.
Pillar 3: Traces
Distributed traces track requests as they flow across service boundaries. A single user action might touch twenty microservices—traces show you the entire journey, with timing for each hop.
Traces answer questions that logs and metrics cannot: Where did the request spend its time? Which downstream service caused the slowdown? How do failures propagate through the system?
Implementing tracing:
- Instrument at boundaries: HTTP calls, database queries, queue operations, external APIs
- Propagate context: Pass trace IDs through all service calls
- Sample intelligently: You cannot store every trace—sample errors at 100%, successes at lower rates
- Use OpenTelemetry: The CNCF standard provides vendor-neutral instrumentation
Connecting the Three Pillars
The pillars become powerful when connected. A spike in error metrics leads you to relevant traces. A slow trace points you to the specific logs explaining why. This correlation is what transforms data into insight.
The key is correlation IDs. Every request should carry a unique trace ID that appears in all three data types. When something fails, you can follow that ID from a metric dashboard to traces to logs, building a complete picture of what happened.
Observability in Practice: A DACH Case Study
A German e-commerce platform was experiencing intermittent checkout failures. Their monitoring showed occasional error rate spikes, but they could not identify the cause. After implementing proper observability:
- Metrics revealed that failures correlated with specific payment provider response times
- Traces showed that timeouts occurred only when a third-party fraud detection service was slow
- Logs exposed that the fraud service was doing synchronous geolocation lookups that sometimes took 30+ seconds
The fix was simple: move geolocation to async processing. Without observability connecting the dots, they would have blamed the payment provider indefinitely.
Building Your Observability Stack
The DACH market offers several proven approaches:
Open Source Stack
- Logs: Elasticsearch/OpenSearch + Kibana, or Loki + Grafana
- Metrics: Prometheus + Grafana, or InfluxDB
- Traces: Jaeger or Tempo
- Instrumentation: OpenTelemetry across all three
Commercial Options
- Full platforms: Datadog, Dynatrace, New Relic, Splunk
- Cloud-native: AWS X-Ray + CloudWatch, Azure Monitor, Google Cloud Trace
For DACH enterprises with data residency requirements, self-hosted open source or EU-region commercial deployments are often mandatory.
Common Observability Pitfalls
Collecting Everything
More data is not better data. Storing every log at debug level will bankrupt your budget and slow your queries. Be strategic about what you collect and how long you retain it.
Dashboard Overload
Fifty dashboards that nobody looks at provide zero value. Build dashboards for specific use cases: on-call triage, capacity planning, business metrics. Kill dashboards that do not get used.
Alert Fatigue
If your team ignores alerts because most are false positives, you have no alerting at all. Every alert should require action. If it does not, it should not be an alert.
Missing Context
Logs without correlation IDs, traces without service names, metrics without labels—all are data without meaning. Invest in proper instrumentation before you worry about fancy visualization.
Starting Your Observability Journey
You do not need to implement everything at once. Start with these priorities:
- Instrument new services with OpenTelemetry from day one
- Add the four golden signals to your most critical services
- Implement distributed tracing for your highest-traffic paths
- Standardize log formats with correlation IDs
- Connect your pillars in a single pane of glass
Observability is not a tool you buy—it is a capability you build. The goal is not perfect visibility into everything, but sufficient insight to debug problems quickly and understand system behavior over time.