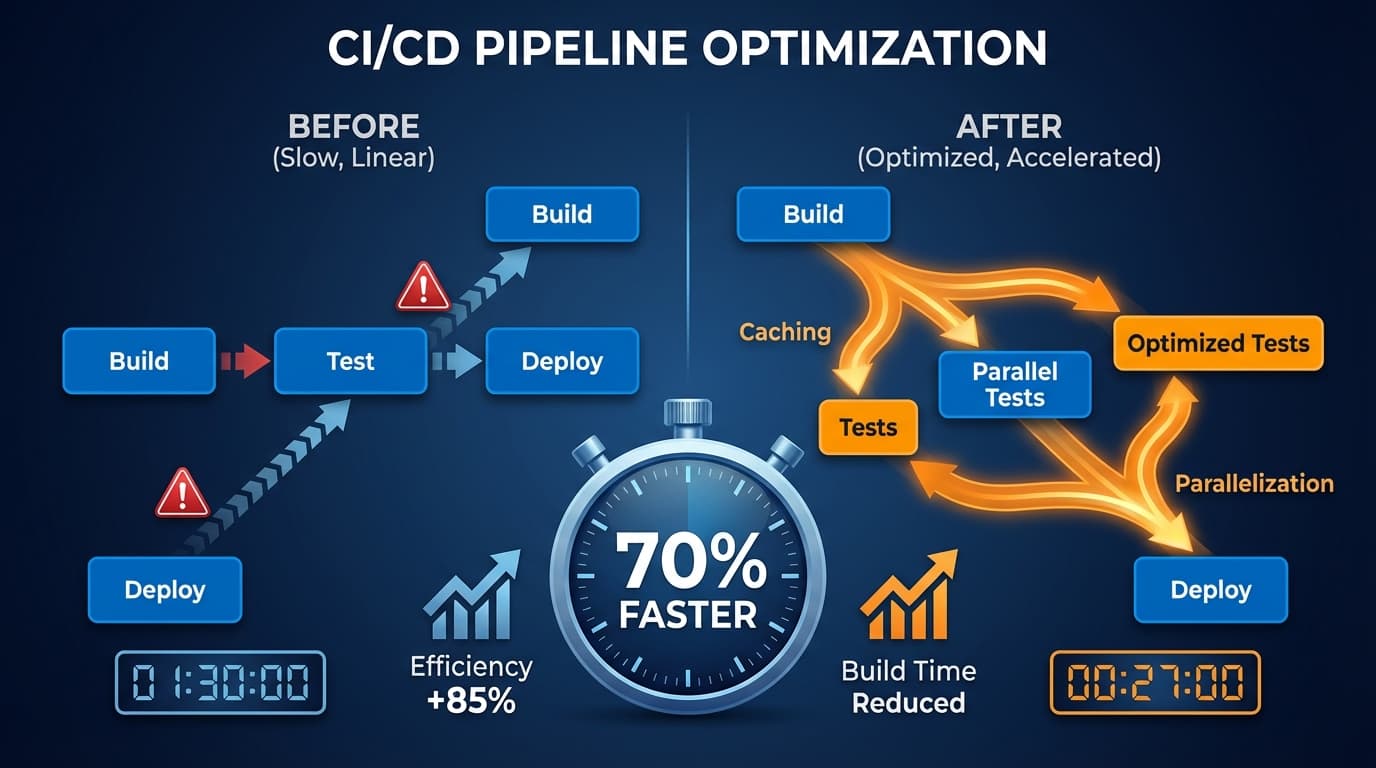
Your developers commit code and wait. Thirty minutes later, the pipeline finishes—or fails on a flaky test, sending them back to fix something that was not actually broken. Meanwhile, context has been lost, focus has shifted, and what should have been a simple change has consumed half the morning. Slow pipelines are not just annoying. They are expensive.
The True Cost of Slow Pipelines
Consider the math: A team of 20 developers commits 8 times per day each. That is 160 pipeline runs. If each run takes 30 minutes instead of 8, the team loses 58 hours of wait time daily. At typical European developer costs, that is over 2,000 euros per day—just in waiting.
But the cost is worse than the calculation suggests. Waiting developers do not sit idle; they context-switch. They start other tasks. When the build finishes, they must switch back, losing the context they built. Studies show this context-switching penalty can consume 40% of a developer's productive time.
Fast feedback loops are not a luxury. They are a competitive advantage.
The Optimization Framework
Before optimizing anything, measure your current state. You need to know:
- Total pipeline duration (p50 and p90)
- Time spent in each stage
- Queue time before execution starts
- Flaky test rate
- Cache hit rate
Without this baseline, you cannot measure improvements or prioritize the right optimizations.
Strategy 1: Parallel Execution
Most pipelines run steps sequentially that could run in parallel. Analyze your pipeline for independent steps.
Common parallelization opportunities:
- Test suites: Unit tests, integration tests, and e2e tests can often run simultaneously
- Multi-platform builds: Building for different architectures or environments
- Static analysis: Linting, security scanning, and type checking are independent
- Test sharding: Split your test suite across multiple runners
Test sharding example:
A 45-minute test suite split across 5 parallel runners completes in 9 minutes—plus a few minutes for orchestration overhead. The math is simple, but the implementation requires test suites that can run in any order without shared state.
Strategy 2: Aggressive Caching
Your pipeline probably rebuilds things that have not changed. Caching eliminates this waste.
What to cache:
- Dependencies: npm packages, Maven artifacts, Python packages—anything fetched from external sources
- Build artifacts: Compiled code, transpiled assets, generated files
- Docker layers: Use layer caching to avoid rebuilding unchanged layers
- Test data: Large datasets or fixtures that do not change often
Cache key strategies:
Your cache key should invalidate when—and only when—the cached content would change:
- Hash your lock files (package-lock.json, yarn.lock, go.sum)
- Include relevant source file hashes
- Version your cache format to invalidate on tooling changes
Strategy 3: Smarter Test Execution
Running all tests on every commit is safe but slow. Smarter approaches run only what matters.
Test impact analysis:
Tools like Bazel, Nx, and specialized test impact analyzers can determine which tests are affected by a code change. Instead of running 5,000 tests, you run the 200 that could actually fail.
Test pyramid enforcement:
Many teams are top-heavy: too many slow end-to-end tests, not enough fast unit tests. Rebalancing the pyramid can dramatically reduce pipeline time while maintaining coverage.
Flaky test quarantine:
Flaky tests destroy developer trust and slow pipelines with retries. Quarantine them: track flaky tests separately, fix them as a priority, and do not let them block the main pipeline.
Strategy 4: Build Optimization
The build step itself often has significant optimization potential.
Incremental builds:
Modern build tools support incremental compilation. Babel, TypeScript, Webpack, and Gradle can all avoid recompiling unchanged code. Ensure your CI configuration preserves the state these tools need.
Build tool selection:
Some build tools are simply faster. esbuild compiles TypeScript 10-100x faster than tsc. Turborepo orchestrates monorepo builds with intelligent caching. Switching tools can be high-effort but high-reward.
Docker build optimization:
- Order Dockerfile commands from least to most frequently changing
- Use multi-stage builds to minimize final image size
- Implement BuildKit for parallelized layer building
- Use remote caching for CI environments
Strategy 5: Infrastructure Improvements
Sometimes the bottleneck is not your pipeline logic but the infrastructure running it.
Runner sizing:
Bigger runners cost more per minute but finish faster. Calculate total cost: a 4-core runner taking 20 minutes often costs less than a 2-core runner taking 45 minutes.
Runner scaling:
Queue time—waiting for a runner to become available—can dominate total pipeline time during peak hours. Autoscaling runner pools eliminate this bottleneck.
Local runners:
For some workloads, self-hosted runners outperform cloud runners. You control the hardware, cache local artifacts, and eliminate network transfer time for large repositories.
Strategy 6: Pipeline Architecture
Sometimes the optimization is not within stages but in how stages are structured.
Fast feedback first:
Arrange your pipeline so the fastest checks run first. Linting catches errors in seconds. Why wait 20 minutes for tests to fail when a syntax error would have failed lint in 10 seconds?
Required vs. optional:
Not every check needs to block merge. Security scans might run post-merge on protected branches. Documentation builds might be optional. Reduce mandatory checks to only what truly must pass.
Merge queues:
For high-velocity teams, merge queues batch and serialize merges, ensuring main always has passing builds without requiring each PR to wait for the full pipeline after rebase.
Case Study: 70% Reduction in Practice
A DACH fintech client came to us with 35-minute average pipeline times. After analysis, we implemented:
- Dependency caching: Saved 4 minutes per run
- Test sharding across 4 runners: Reduced test time from 18 to 6 minutes
- Docker layer caching: Saved 5 minutes on image builds
- Parallel static analysis: Ran linting, security scans, and type checking simultaneously
- Flaky test quarantine: Eliminated 2-minute average retry penalty
Result: 35 minutes down to 10 minutes—a 71% reduction. Developer satisfaction scores improved significantly. Deployment frequency increased from 3 times daily to 12.
Measuring Success
Track these metrics to validate improvements:
- p50 and p90 pipeline duration: Percentiles matter more than averages
- Cache hit rate: Target 90%+ for dependency caches
- Queue time: Should approach zero during normal hours
- Pipeline success rate: Should improve as flaky tests are fixed
- Developer satisfaction: Survey regularly on CI/CD experience
Where to Start
You cannot implement everything at once. Prioritize based on your baseline measurements:
- Measure first: Add timing to every pipeline stage
- Cache dependencies: Usually the easiest win with immediate impact
- Parallelize tests: Often the largest single improvement
- Fix flaky tests: Reduces retries and improves trust
- Optimize the longest stages: Focus where the time actually goes
Fast pipelines are not about cutting corners—they are about eliminating waste. Every minute your pipeline runs is a minute developers wait, context decays, and productivity suffers. The techniques here are proven across dozens of implementations. Your 30-minute build can become an 8-minute build. The only question is when you start.